Python app with Streamlit: Boids algorithm example
Create easily an interactive app of your python projects with Streamlit.
Published on December 03, 2022 by Francesca Priante
Python Streamlit
Here I show how to develop a simple interactive app using Streamlit package in Python. The aim of the app is to plot flocks animations with different user-defined parameters. To have a deeper insight on the algorithm used to produce flocks patter, take a look on my previous post on boids algorithm.
Packages
You can install Streamlit easily using conda or with pip.
In this line I import the move function which is the core of the boids algorithm, explained in the previous post.
from function import move
and then I import all the rest of the packages:
import streamlit as st
import time
import numpy as np
from streamlit.hello.utils import show_code
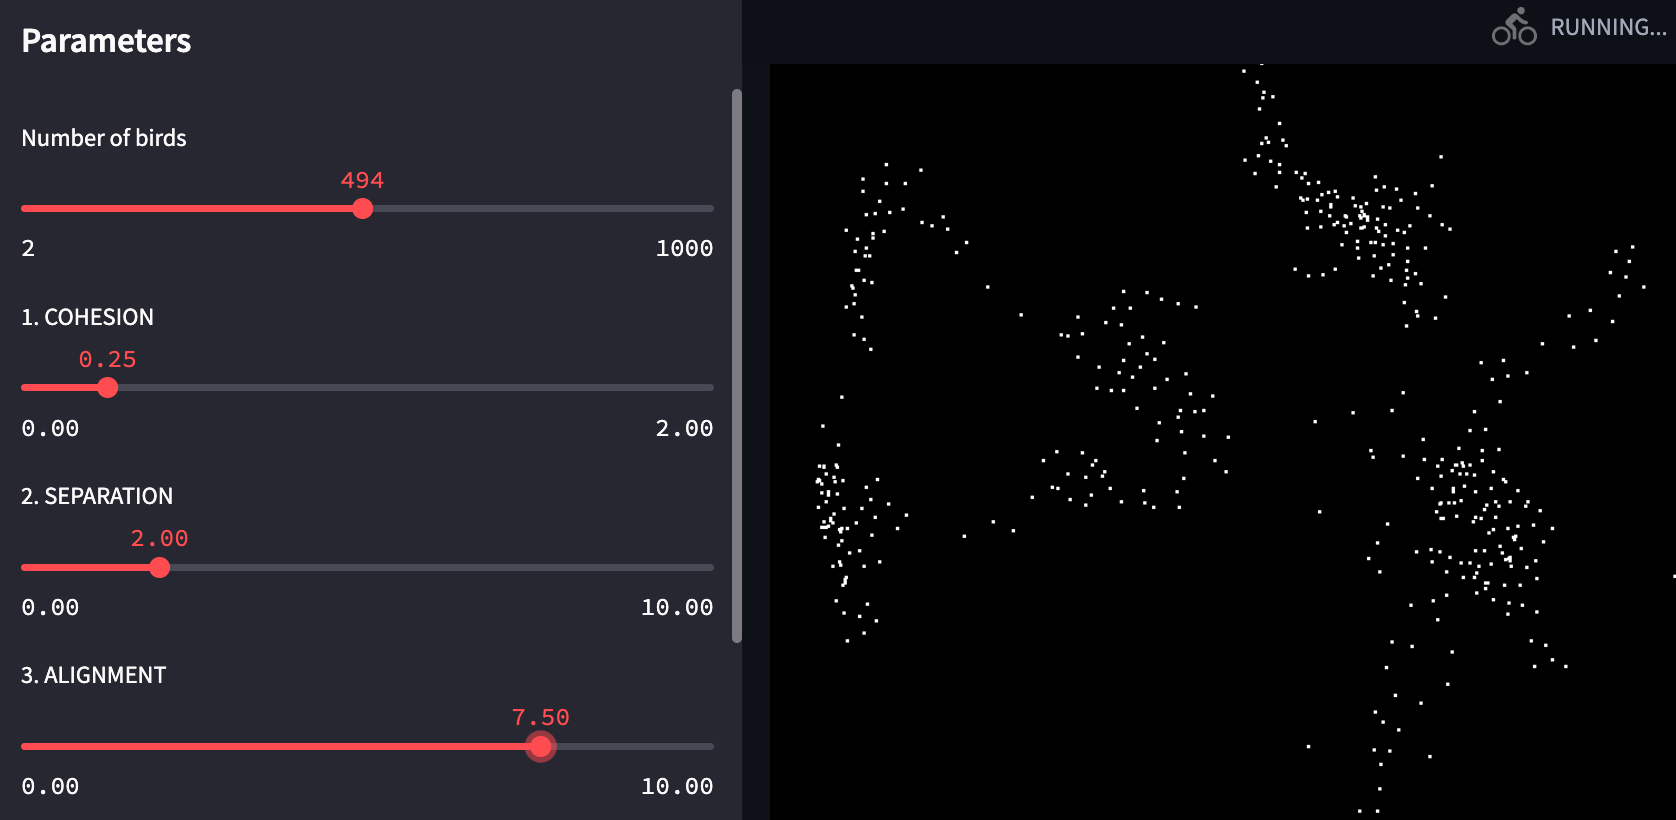
Lateral bar with parameters
Streamlit code has the core within the function animation_demo() which is composed by 3 main parts, where I:
- Set up the parameters (both the fixed ones and user-defined).
- Run the boids algorithm.
- Plot the image: personally this was the hardest part, because I choose not to use matplot.lib because it was not so quick as I expected, and the birds movements were not so smooth. Therefore I chose to create the animation plotting “pixel by pixel”.
1. Parameters setup
with sidebar.slider you can create a slider with values ranging from min_value to max_value and with an incremental step of step and the default value is encoded in value parameter.
def animation_demo():
    # %%
    L = 450
    tsteps = 500
    V0 = 20                      # Initial velocity

    wall_repulsion = V0          # https://vanhunteradams.com/Pico/Animal_Movement/Boids-algorithm.html#Screen-edges
                                 # should be similar to max speed, otherwise they escape
    margin = 40
    max_speed = V0

    # %%
    n = st.sidebar.slider("Number of birds", min_value= 2, max_value = 1000, value = 300, step =2)

    # Rule 1
    # velocity to center contribution
    R = st.sidebar.slider("1. COHESION",
                          min_value=0.,  max_value=2., step = 0.05, value = 0.1)

    # Rule 2
    bird_repulsion = st.sidebar.slider("2. SEPARATION",
                                       min_value=0., max_value=10., step = 1., value = 7.)
    # Rule 3
    match_velocity =  st.sidebar.slider("3. ALIGNMENT",
                                       min_value=0., max_value=10., step = 0.5, value = 3.)


    # Community distance (~ community size)
    neighbors_dist = st.sidebar.slider("Community distance i.e. distance of influence between birds (From spread to packed). Applied to rule 1 and rule 3)",
                                       min_value = 10, max_value=200, value = 70)

    privacy = st.sidebar.slider("Bird privacy (distance at which we apply rule 2)",
                                       min_value=0, max_value=30, step = 1, value = 14)
    # low values make more "stains" of birds, nice visualization
    # When they see each other at this distance,
    # they apply bird repulsion in the other direction

    progress_bar = st.sidebar.progress(0)

    frame_text = st.sidebar.empty()
2. Run the algorithm
In this block we run the algorithm and save the birds position in a (L2+margin) x (L2+margin) matrix N. L*2+margin is the plot width and height, margin parameter is used to keep the birds at distance from the wall, otherwise they somethime cross the boundaries, rising an error. This matrix is updated at every time step.
3. Show animation plot
The matrix N is initially filled with zeros, and then, after running the move() function, each boid position is updated with a 1. This is also used to color the pixel on screen: a value of 1 means white, and a value of 0 means black.
Resolution problem: In order to have smooth movements I chose the plot to be 940 pixels wide (L*2+margin). But this means that it is almost impossible to see a single boid (so a single pixel) moving using an ordinary screen. So I needed to increase the size of the points from 1 pixel to 5 pixels. To do so I shifted and added up the matrix to 1 pixel to the right, left, up and down. The boid was then no more represented by a single pixel, but 5 pixels forming a cross. This was enough to improve the visibility of the boids.
    image = st.empty()

    # %% INITIALIZE
    x = np.zeros((n,tsteps))
    y = np.zeros((n,tsteps))

    x[:,0] = np.random.uniform(low=-L, high=L, size=(int(n),))
    y[:,0] = np.random.uniform(low=-L, high=L, size=(int(n),))

    x[:,1] = x[:,0] + np.random.uniform(low=-V0, high=V0, size=(int(n),))
    y[:,1] = y[:,0] + np.random.uniform(low=-V0, high=V0, size=(int(n),))


    y = y.astype(int)
    x = x.astype(int)

    # %% MOVE
    N = np.zeros((L*2+margin, L*2+margin))
    last_col = np.shape(N)[0]-1
    for t in range(1,tsteps-1):
        x[:, t+1],y[:, t+1] = move(x[:, t],y[:, t], x[:,t-1],y[:,t-1],
                                   n, neighbors_dist, R, privacy, bird_repulsion, match_velocity, L, margin, wall_repulsion, max_speed)

        y = y.astype(int)
        x = x.astype(int)
        N = np.zeros((L*2+margin, L*2+margin))
        # N[y[:,t]+L+10, x[:,t]+L+10] = 0
        N[y[:,t+1]+L+round(margin/2), x[:,t+1]+L+round(margin/2)] = 1

        # Increase the size of the points
        to_plot = N
        to_plot[1:last_col,:] = N[1:last_col,:] + N[0:(last_col-1),:] # right shift of the matrix
        to_plot[:,1:last_col] = N[:,1:last_col] + N[:,0:(last_col-1)] # upper shift of the matrix
        to_plot[0:(last_col-1),:] = N[0:(last_col-1),:] + N[1:last_col,:] # left shift of the matrix
        to_plot[:,0:(last_col-1)] = N[:,0:(last_col-1)] + N[:,1:last_col]  # bottom shift of the matrix
        to_plot = np.ceil(to_plot/np.amax(to_plot))

        image.image(to_plot, use_column_width=True)
        time.sleep(0.05)

    # We clear elements by calling empty on them.
    progress_bar.empty()
    frame_text.empty()

    # Streamlit widgets automatically run the script from top to bottom. Since
    # this button is not connected to any other logic, it just causes a plain
    # rerun.
    st.button("Re-run")
Finally you can write a title and a markdown description of the code and run the animation calling the function animation_demo()
st.set_page_config(page_title="Flocks", page_icon="🐤") #  📹
st.markdown("# Flock Animation")
st.sidebar.header("Parameters")
st.markdown(
    """The animation shows a simulation of a flock of birds.
Flocks of birds follows three rules simulataneously:
1. __Cohesion__ rule: a bird flies towards the center of mass of the nearest neighbors.

2. __Separation__ rule: a bird tries to avoid collisions with other birds.

3. __Alignment__ rule: a bird tries to match velocity with near birds.

You can change the intensity of these rules moving the sliders in the lateral bar.

More details in my github page [https://frapria.github.io/blog/flocks](https://frapria.github.io/blog/flocks)
"""
)

animation_demo()
show_code(animation_demo)
To run the app yopu just need to run this line of code in bash
streamlit run flock_app.py
and you just need to copy the Local URL that is displayed and paste it in whatever browser you use.
Deployment
Hehe this is a sore subject! I have tried to doploy this app on both HuggingFace and Streamlit cloud, but I would require more resources that I am available of. In HuggingFace the app is formally running, but the animation is irregular, unsmooth and crappy. I should buy CPUs to make it work, but for now, I don’t see any benefits.
To run it locally you can clone my repository: https://github.com/FraPria/boids_algorithm_app